800-454-9103



Paid Search & Local SEO Case Study
From one truck to an $80M run rate in 40 months!
A brand-new Florida PHCE contractor signed with Ferocious in January 2023 with no website, no reviews, no brand recognition and no customer list. They opening for business in April of 2023 -- Ferocious has run every part of their digital marketing since day one — starting with the website itself.
~135M
Booked since launch
~190K
Jobs Completed
12.7x
Return per marketing dollar
+33%
Growth, year over year
Client identity is withheld and revenue figures are rounded. March 2023–July 2026: revenue and jobs from the client’s field service system; marketing performance from Searchlight, Google Ads, Google Business Profile, Ahrefs and Semrush. Results reflect one client in one market and are not a projection of future performance.
The Whole Story, In One Chart
Booked revenue, every month since launch.
Hover over any month
Mar 2023 → Jul 2026
Year 1
Year 2
Year 3
Year 4 to date
$8M
$4M
$2M
2023
2024
2025
2026
First full month ~$0.4M → best month to date ~$7.8M. Same company, same market, 18× the monthly revenue.
The Timeline
Each layer had to be standing before the next one paid off.
A brand-new contractor cannot buy its way to $60M. This is the order we built it in, and what each step returned.
The website, live before the first service call
No brand recognition, no reviews, no customer list — so the site had to do the selling. We shipped it, wired call tracking into it from the first hour, and gave every trade its own booking path. First full month of operation booked roughly $40k.
Website build
Call tracking
~$40k first full month
Local Services Ads, then paid search around them
LSA charges per lead and sits above everything on a Google search — the highest-intent inventory on the internet for a contractor. We took top impression share from zero to effectively 100% inside three months and have held it there ever since.
0 → ~99% top impression share
Search, Microsoft, social
Attribution before scale
Before spending harder we made the spend legible. Searchlight, our trusted attribution platform, matched every call, form and chat to the customer record in ServiceTitan and followed it to a closed invoice. From there, budget decisions stopped being arguments and turned into the fuel.
10,100 jobs
Closed-loop attribution
Local SEO turned into a compounding asset
Three Google Business Profiles under active management — never-ending and consistent posts, photos, categories and services, citation consistency, and a review engine now producing 90+ new reviews a month at a 4.8 rating with 97%+ of them answered. The profiles alone generated ~8,500 leads and ~$4.8M in booked revenue over the past year.
3.1× on Year 1
32,000 jobs
90+ reviews / month
Shortening the path from click to appointment
Online scheduling, Reserve with Google and automated speed-to-lead follow-up went on top of the existing demand. Those booking tools alone are credited with roughly $5.3M in booked revenue in 2026 so far, and the booking rate moved from 42% to 50% on the same leads.
2.0× on Year 2
66,400 jobs
42% → 50% booking rate
Still climbing, and still measured in dollars
Annualized on the last six completed months, with January–July 2026 running 33% ahead of the same months in 2025. Every number on this page is booked or closed revenue out of the field service system — not impressions, not clicks.
+33% year over year
~190,000 jobs to date
| Service year | Booked revenue | Jobs ran | Growth |
|---|---|---|---|
| Year 1Apr 2023 – Mar 2024 | ~$10M | 10,100 | — |
| Year 2Apr 2024 – Mar 2025 | ~$31M | 32,000 | 3.1× |
| Year 3Apr 2025 – Mar 2026 | ~$62M | 66,400 | 2.0× |
| Trailing 12 monthsAug 2025 – Jul 2026 | ~$67M | 80,600 | — |
The Economics
Every marketing dollar returned about thirteen.
Trailing twelve months, measured on revenue that actually closed in the field service system.
12.7×
Blended return
~$4.3M in managed spend and fees against ~$54M in attributed closed revenue.
6.2×
Paid media return
~$26M closed from advertising across 34,700 leads.
~$7.7M
Organic and local revenue
Off roughly $35K of tooling — the highest-margin channel in the program.
~70%
Booking rate
Up from 67% a year ago. Same leads, more booked jobs.
Focus · Google Local Services Ads
The channel we optimized hardest is the one that pays best.
LSA charges per lead instead of per click and sits at the very top of the results page of Google — but only if your profile is setup perfect and only if every lead gets answered... quickly. This Channel consistently has a strong ROAS.
9.3×
LSA return on spend
Against 6.2× across all paid media — our single most efficient paid channel.
28%
Of all paid revenue
Produced on just 18% of paid spend.
21,200
LSA leads to date
10,300 of them in the past twelve months alone.
~99%
Top impression share held
Sustained for two and a half years — effectively always visible.
LSA leads delivered per month
Sep 2023 → Jul 2026
1,500
1,000
500
2023
2024
2025
2026
What optimizing actually meant
We tripled the lead volume, then made the leads worth more.
Early on the work was ranking mechanics: get to the top of the pack and stay there. Monthly lead volume went from about 320 to a peak of roughly 1,500.
Then the work shifted to quality. We tightened service categories and job types, expanded the service-area map by trade, pushed review velocity to feed the Google Guaranteed ranking, and fed booked-job outcomes back into the channel.
Cost per lead did rise over that span — that is what buying the whole top of the market looks like. It is the right trade: we paid more per lead and got a higher return per dollar, because the leads convert better and the jobs are bigger.
320 → 1,500
Peak monthly LSA leads
9% → 20%
Lead-to-customer rate
0 → ~99%
Top impression share
9.3×
Return, vs 6.2× paid average
Channel Performance, Month by Month
Both engines are still climbing.
Attributed closed revenue by channel for the trailing twelve months. Every dollar below is a job that closed in the field service system, matched back to the source that created it.
SEO revenue per month, including Google Business Profiles
Google Business Profiles
Other organic search
Trailing 12 months
$1.0M
$0.5M
Google Business Profiles drive 63% of all organic revenue. Organic revenue rose 27% across the second half of the year — while the SEO industry is largely reporting a traffic decline due to "Zero Click Searches".
Paid search revenue per month, with return on spend
Closed revenue
Return on ad spend
Trailing 12 months
Paid revenue grew ~17% across the year while return improved from 5.6× to 6.6×. Growing spend usually costs you efficiency. Here it bought more.
How We Know
Confidence, then gasoline. Searchlight.
Most contractors are guessing. They see leads in one system, spend in another, and revenue in a third, and nobody can say which campaign paid for the truck.
Searchlight, a third party and trusted attribution platform of choice, closes that loop. It matches every call, direct booking and form to the customer record in the field service system, then follows that customer all the way to a closed invoice. The result is accurate attribution at the campaign level — not modeled, not last-click guesswork.
That accuracy is what makes aggressive growth safe. When we can see exactly which campaigns produce booked revenue and which produce noise, we stop debating and start moving budget — every month, with the receipts to back it up.
The Ferocious 3-Day Call Board
Budget follows capacity, by trade, three days out.
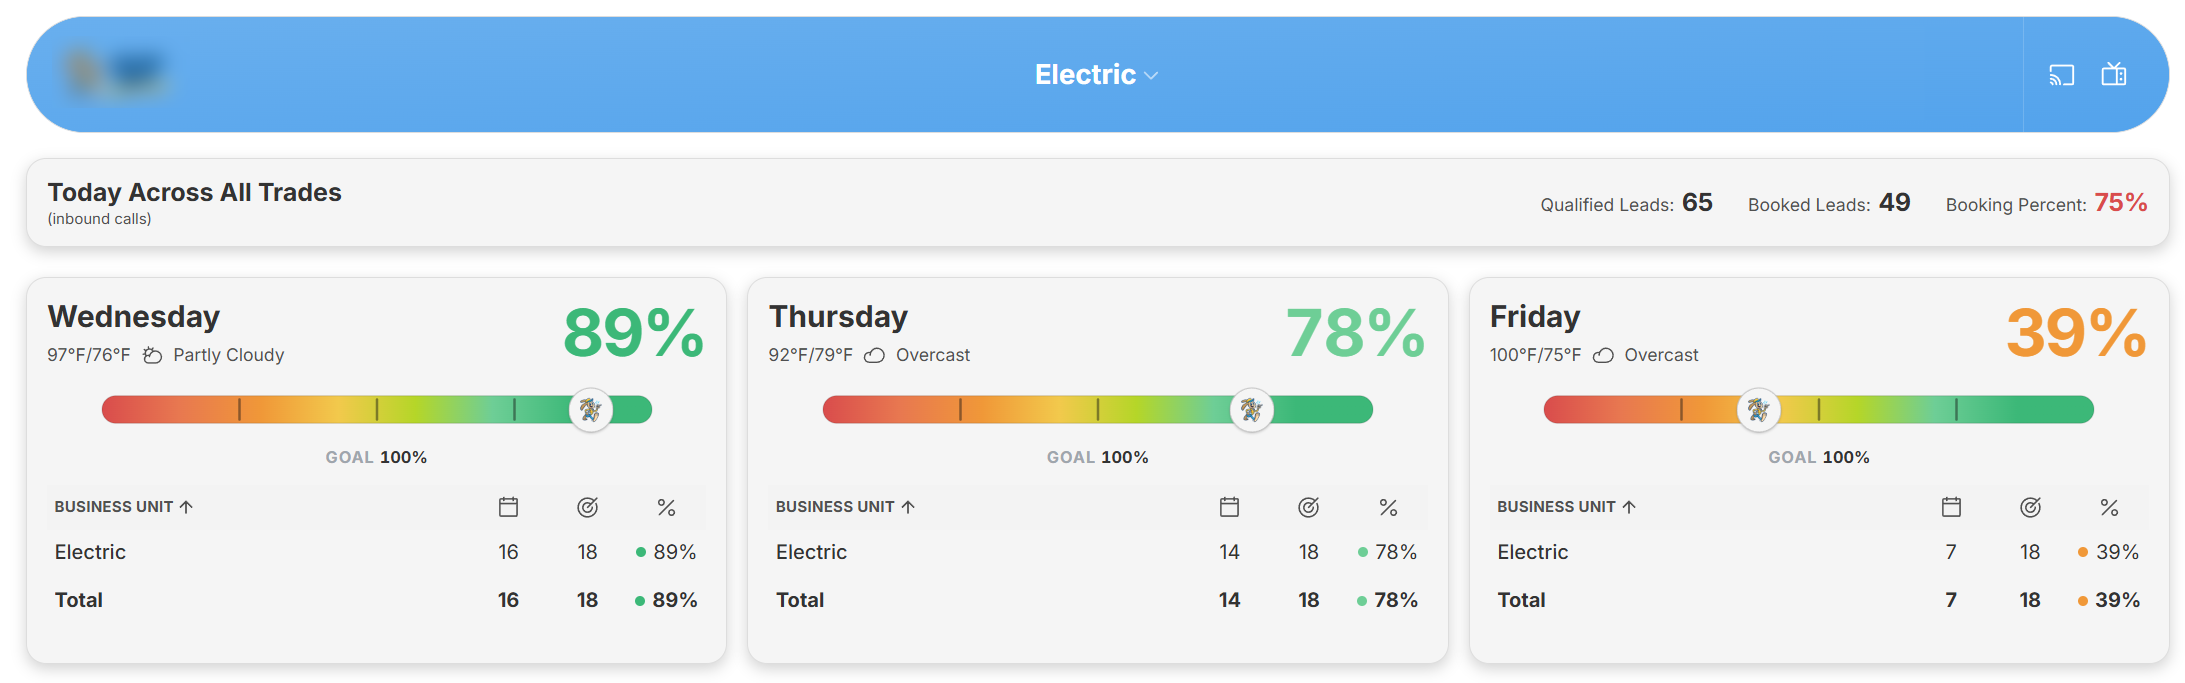
Spending hard into a trade that has no open trucks wastes money and burns customers. The 3-Day Call Board gives us a live read on demand against capacity for each trade — booked calls versus goal for today and the next two days.
When electrical is sitting at 39% of goal on Friday, that is where the budget goes. When a trade is full, we pull back and let the others breathe. It turns ad budget into a dial we turn daily instead of a number we set monthly.
The Search Footprint
Built from nothing, in three years.
0→27
Domain authority
6,200
Ranking keywords, peak
~600
Top-3 positions, peak
+67%
Local pack keywords, YoY
Like most sites with a content library, this one was affected by Google's recent core updates and the continued rollout of AI Overviews. Since March, third-party tools show organic sessions down sharply.
We traced it to a specific place: four national how-to articles — breaker sizing, garbage disposals, toilet mechanics — account for most of the decline. Those pages are still indexed and still ranking. They lost the click, not the position, because roughly 70% of the keywords they rank for now return an AI Overview above the results.
Everything that actually books work kept growing through the same window: local pack presence, domain authority, and organic-attributed booked revenue. We report this openly because a prospect who checks the same tools will see the same dip — and because informational content was never the revenue engine here. The local presence is.
+67%
Local pack keywords, YoY
+56%
Organic booked revenue, Jan–Jul
26→27
Domain authority, same period
−50%
Clicks per ranking keyword
Most contractors can't tell you which dollars are working.
We tie every lead back to the job it became and the revenue it closed. Bring us your numbers and we will show you where the growth is hiding.
~190,000
Jobs on our watch
One client. Forty months. Built from zero.

Ready for success?
Take the first step toward accelerating your business growth today!